


No Greenfield Factories Required:
The Hidden Infrastructure Behind
VENDOR Energy Systems
VENDOR.Max is an Armstrong-type nonlinear electrodynamic oscillator operating in a controlled discharge-resonant regime at TRL 5–6. A startup impulse initiates the operating regime; regulated internal feedback maintains regime conditions; and complete device-boundary accounting remains governed by:
This boundary equation applies at the complete device boundary only; internal flow is governed by eight distinct architectural stages, each with its own physical quantities — see How VENDOR.Max Works. Here P_in,boundary is an aggregate complete-device accounting quantity, defined at the complete device boundary only; it does not represent a continuous external supply or a single physical input port.
Air and gas serve as an interaction medium for field dynamics — not as an energy source. The system does not create energy, does not extract energy from air, and does not operate as a perpetual motion or over-unity device.
Validated at TRL 5–6 with over 1,000 cumulative operational hours, including a 532-hour continuous cycle under fixed load. Patent: WO2024209235 (PCT); ES2950176 (granted, Spain).
The Biggest Misunderstanding in Deep-Tech Energy
Everyone assumes you need to build factories.
New materials. New supply chains. New certification labs. New engineering teams. Hundreds of millions in CAPEX. Three to five years before the first unit ships.
This assumption shapes how investors evaluate energy hardware projects — and it is precisely why most of them never get funded. The risk profile is simply too heavy.
VENDOR is built on a different premise entirely.
Core Thesis
VENDOR is not entering the infrastructure power market as a new hardware manufacturer. It is entering as a system that can be produced on top of an already existing global industry.
Ionization- and plasma-based hardware manufacturing is not merely adjacent to VENDOR. It is structurally compatible — at the level of components, processes, supply chains, and certification infrastructure.
The broader air purification industry already exceeds $50 billion annually, while ionization- and plasma-based subsegments form a smaller but industrially relevant technological base within it. Together, these subsegments have spent decades building exactly what a new energy hardware company would otherwise need to construct from scratch. VENDOR connects to that base — and reconfigures it for a higher-order application: infrastructure-grade power delivery in a resonant operating regime.
The Industry at Scale: Context, Not Destination
Before examining the overlap, it is worth establishing the scale of the existing production base. The broader air purification industry forms the industrial umbrella; ionization- and plasma-based subsegments are the directly relevant manufacturing layer. This is not the market VENDOR is targeting — it is the production infrastructure VENDOR is designed to leverage.
2032 — $53.35B (CAGR 8.5%) Source: Data Bridge Market Research
CAGR — 7.6%
Growth driven by AI integration and predictive systems Source: aggregated commercial market-research databases
2033 — $27.6B (CAGR 11.9%)
Growth driver — IoT and automation Source: aggregated commercial market-research databases
2033 — $450M (CAGR 7.5%)
Application — industrial gas cleaning Source: aggregated commercial market-research databases
2033 — $750M (CAGR 6.5%)
Segment — anti-static treatment in manufacturing Source: aggregated commercial market-research databases
2031 — $1.75B (CAGR 7%) Source: aggregated commercial market-research databases
This is not a market of "small consumer devices." It is a global industrial base — proven, certified, operating at scale — that already contains a substantial portion of the required manufacturing capabilities for VENDOR.Max initial production, particularly in high-voltage generation, insulation architecture, enclosure engineering, and EMC compliance.
Figures above are drawn from commercial market-research databases and are provided for contextual illustration only; see References → Market & Industry Data Sources. They are not investment projections.
Manufacturing Compatibility: Why Ionization Infrastructure Is Relevant to VENDOR Production
Interpretation note: The following analysis is framed within the context of manufacturing competency overlap between controlled high-voltage discharge systems and the VENDOR.Max architecture. It does not imply functional identity between ionization devices and VENDOR power nodes — only that the underlying manufacturing competencies, subsystem categories, and compliance workflows substantially overlap.
At the core of both air ionization devices and VENDOR systems lies a shared engineering layer — controlled high-voltage discharge handling and the high-voltage subsystem architecture around it. This creates a meaningful overlap at the manufacturing and engineering competency level.
Ionization hardware already contains
Existing manufacturing base
- High-voltage generation stage (1–10 kV)
- Corona discharge elements in ionization products
- Field-controlled ionization zones
- Pulse or quasi-pulse operation modes
- Dielectric isolation and safety architecture
- EMC-compliant enclosures and shielding
VENDOR.Max requires
Target production architecture
- Controlled discharge regime — the regime-forming path (drive stage)
- Field-driven energy structuring in resonant mode
- Resonant coupling between functional stages
- Inductive output extraction — the output-extraction path (load stage)
- Feedback-controlled stability loop (Buffer/BMS)
This does not imply that an ionizer and a VENDOR.Max unit are functionally identical products. The claim is narrower — and industrially more important: the underlying manufacturing competencies, subsystem categories, and compliance workflows substantially overlap, which can materially shorten industrialization time and reduce capital intensity relative to greenfield development.
The overlap is not merely superficial; it is structural at the level of high-voltage generation, discharge handling, insulation architecture, enclosure engineering, and manufacturing workflow. From a production standpoint, VENDOR.Max can be interpreted as a higher-order configuration built on already industrialized high-voltage and ionization subsystems — not a fundamentally new manufacturing category.
Manufacturing Reality: No New Greenfield Factories Required
For initial industrialization, VENDOR.Max does not necessarily require greenfield factory construction. In the base-case manufacturing scenario, existing ionization and high-voltage production lines can be adapted with limited modifications.
What already exists at global scale
- Fully established supply chains for HV components, ceramics, and precision electronics
- Manufacturers operating within established CE/UL conformity pathways and ISO-governed production and quality systems
- Experienced engineering teams familiar with HV assembly, EMC testing, and safety compliance
- Mature cost structures across all major production geographies
What adaptation is expected to involve
- Minor line modifications to accommodate the VENDOR.Max high-voltage subsystem and control architecture
- Additional testing procedures specific to the resonant operating regime
- Software and control layer updates for feedback-stabilized operation
Preliminary industrial assessment suggests that the engineering adaptation phase may fall within a 3–6 month window, with capital modification requirements potentially in the low-single-digit million USD range. These figures are a preliminary scenario estimate, subject to partner audit, certification scope, power class, and localization model.
VENDOR base-case scenario
$1–3M
preliminary adaptation CAPEX estimate · 3–6 months · subject to partner auditGreenfield energy hardware
$40–185M
new factory build · 2–3 years minimumRelative to greenfield energy hardware manufacturing, this approach may reduce industrial entry CAPEX by up to an order of magnitude in favorable scenarios — subject to the same audit, certification, power-class, and localization variables noted above.
Geography of Production: The Base Is Already Built
The mature production map of the ionization industry translates directly into a global manufacturing network accessible to VENDOR — without construction, without greenfield recruitment, without greenfield industrial investment.
Clusters: Guangzhou, Shenzhen, Dongguan. Fully integrated supply chain from plastics to precision electronics. Large-scale production capacity reaching tens of millions of units annually.
Leaders: Simco-Ion, EXAIR, Honeywell. Focus on industrial systems with high added value. Trend: reshoring under tariff and supply chain policy shifts.
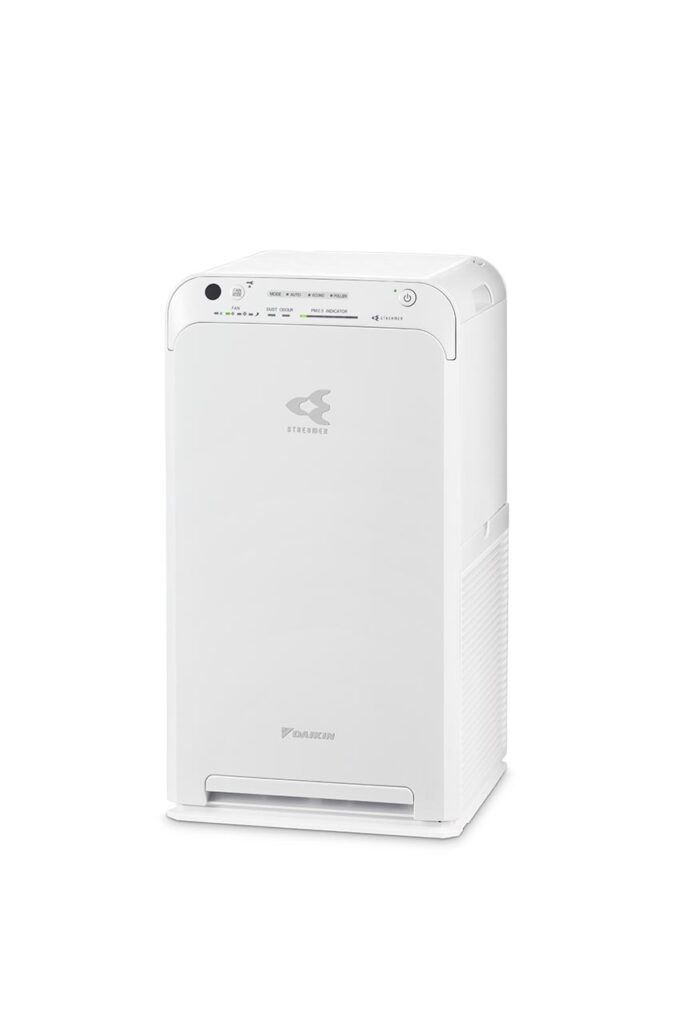
Companies: Sharp, Panasonic, Daikin. Innovations: Plasmacluster™, Nanoe™, multi-stage plasma. Premium segment, strong R&D culture.
Focus: industrial applications and quality standards. High-precision plasma systems. Strict ecological and energy efficiency regulations already embedded in production.
Manufacturing Compatibility, Not Functional Equivalence
The overlap between ionization hardware and VENDOR.Max is a manufacturing and engineering-competency overlap. It is not a claim of functional equivalence between an ionizer and a power node, and it is not a basis for any secondary product claim.
Because VENDOR.Max operates through controlled discharge dynamics, field-mediated interaction with the surrounding medium is intrinsic to the operating regime. Any environmental or field-related side effects that may arise are a consequence of the underlying physics — not engineered product features, and not marketed functions of the system.
VENDOR.Max is positioned and evaluated solely as a power node. Air and gas serve as an interaction medium for field dynamics, not as an energy source. Any potential secondary effects in shared facilities remain outside the validated scope, are not part of any product claim, and would require separate validation before being represented as a function.
The practical consequence of this framing is narrow and deliberate: the value of the ionization base to VENDOR is industrial — shared subsystems, supply chains, and certification pathways — rather than functional carry-over from one product category to another.
Production Capacity and Cost Economics
The air ionizer industry has been refining efficiency for decades: from mass OEM production in China to premium product lines in Japan and Europe. Cost structures are transparent, supply cycles are well established, and production know-how is deep.
Household ionizers (OEM China)
Industrial ionizers
New product entry cost structure
Entry costs on this industrial base are, in this manufacturing pathway scenario, orders of magnitude lower than classic deep-tech hardware, where tooling alone reaches millions of dollars.
Serial production: speed and scale
SKD model (Semi-Knocked Down)
Technology Trends: An Industry Ready for Upgrade
The air ionization industry operates at the intersection of digital controls, IoT, energy efficiency requirements, and environmental standards. These trends make the base not only stable — but directionally compatible with VENDOR's deployment model.
Artificial Intelligence
Smart ionization control systems adjust operating modes automatically. Predictive maintenance reduces costs. Adaptive algorithms optimize discharge parameters. For VENDOR: the same control architecture applies to feedback-managed power delivery in a resonant operating regime.
IoT and Remote Monitoring
Full integration with industrial and infrastructure management ecosystems. Cloud-based analytics and remote diagnostics reduce operating costs. For VENDOR: a ready foundation for distributed site-autonomous power node monitoring and fleet management.
Energy Efficiency
Device consumption: 3–100 W. Operating costs comparable to an LED bulb. Markets already accept low-footprint, continuous-operation hardware in this category — a behavioral baseline VENDOR.Max can build on.
Environmental Standards
Purification without chemicals; reduced carbon footprint. CE/UL conformity and ISO quality systems are already embedded in manufacturing processes. For VENDOR: certification infrastructure exists and is actively maintained — not created from scratch.
Market Challenges — and Why They Work in VENDOR's Favor
1. High Initial Investments (for traditional players)
- Industrial plasma systems: $200,000–500,000 per installation
- RF generator market: projected at $1.2B by 2030, but entry costs remain high
- Payback cycles: 2–4 years in industrial scenarios
For VENDOR: by integrating into existing infrastructure rather than replacing it, the entry threshold is designed to be substantially lower. The industry barrier becomes a strategic advantage.
2. Demand Cyclicality
- Market fluctuations of 30–40% every 3–4 years, driven by semiconductor sector cycles
- Geopolitics and tariff volatility amplify this instability
For VENDOR: not a risk but a diversification instrument. VENDOR.Max addresses infrastructure power delivery — a segment with stable, long-cycle demand independent of consumer electronics cycles.
Strategic Partners: Manufacturing Pathway from Day One
Tier 1 — Global Leaders
Sharp (Plasmacluster™)
Factories in Japan, China, Malaysia
Panasonic (Nanoe™)
Global manufacturing network, strong R&D
Simco-Ion
Industrial high-power systems for critical sectors
Tier 2 — Chinese OEM Giants
Olansi Healthcare
60,000 m² facility — full-cycle production, CE/ISO certified
HisoAir
Precision engineering, established certification base
Models of Collaboration
OEM Partnership
VENDOR provides IP and technical specifications; partner adapts existing production lines; joint branding and profit-sharing
Licensing
Use of VENDOR patents, royalties, exclusivity by region
Joint Venture
Shared investment, joint R&D, division of global markets
Scenario-Based Commercial Model
The following projections represent scenario-based planning estimates, not guaranteed outcomes. They are provided to illustrate the order-of-magnitude opportunity enabled by VENDOR's manufacturing approach. Actual results depend on commercialization timeline, regulatory approvals, certification milestones, partner agreements, and market conditions at the time of deployment. VENDOR.Max is currently pre-commercial at TRL 5–6; no figure below should be read as a near-term revenue commitment.
VENDOR Addressable Market
Economics of Production (design targets)
Illustrative Post-Certification Scaling Scenario
The phases below are an illustrative post-certification scaling scenario, not a dated forecast. They describe a possible sequence that begins only after independent validation and certification milestones are met, and are deliberately decoupled from specific calendar years given the current pre-commercial status.
Investment Attractiveness: Why the Risk Profile Is Different
Reduced Infrastructure Risk
No greenfield factory construction, new supply chains, or full engineering team buildout required in the base-case industrialization scenario. The ionization industry has already established them at global scale, over decades.
Minimal Capital Expenditure
Estimated production launch CAPEX: $1–3M base-case scenario, vs. $40–185M for greenfield manufacturing. This is a preliminary scenario estimate, subject to partner audit, certification scope, power class, and localization model. Estimated ROI horizon is scenario-dependent and contingent on commercialization timing.
Proven Industrial Base
The cited air purification umbrella market is projected at 8.5% CAGR, with stable demand. Existing certification pathways, supplier relationships, and production know-how across all major manufacturing geographies.
Technological Synergy
A substantial share of relevant production competencies overlap between ionization hardware and VENDOR.Max. One R&D center supports two product lines. Cross-deployment and up-selling opportunities across both domains.
Competitive Defensibility
Barriers to Entry
- Patent portfolio — WO2024209235 (PCT); ES2950176 (granted, Spain); EP4693872 (EPC member states, under examination)
- Exclusive OEM partnerships in target production clusters
- First-mover position in resonant-regime site-autonomous power node architecture
- 1,000+ cumulative operational hours and 532-hour continuous cycle — validation data not replicable without equivalent engineering history
Sustainable Advantages
- Dual use of production assets across ionization and power delivery domains
- Economies of scale in R&D and manufacturing shared across product lines
- Risk diversification: two independent demand segments from a single production base
- IP protection of core operating regime under active patent coverage
What VENDOR Is Not: Engineering Classification Note
Correct classification of VENDOR technology is material to proper evaluation.
VENDOR.Max is not a perpetual motion machine. It does not produce energy from nothing.
A startup impulse initiates the operating regime; complete device-boundary accounting remains applicable throughout operation:
This equation applies at the complete device boundary only — the eight-stage boundary-closure stage; internal stages have separate governing formulas. See How VENDOR.Max Works for the eight-stage map.
Air and gas serve as an interaction medium for field dynamics — not as an energy source.
The system operates within classical electrodynamics as an open nonlinear resonant architecture — not as a closed-loop or over-unity device.
Validation status: TRL 5–6. Claims are bounded by validated operating conditions, not extrapolated to general deployment.
The correct engineering frame: an Armstrong-type nonlinear electrodynamic oscillator operating in a controlled discharge-resonant regime, designed for infrastructure-grade power delivery without conventional fuel logistics. Patent: WO2024209235.
Conclusion: This Is Not a New Industry
Most energy hardware startups attempt to build greenfield factories. VENDOR does not.
It connects to an industry that already exists, already scales, and already operates globally — then reconfigures that base for a higher-order application: infrastructure-grade power delivery in a resonant operating regime.
This changes the risk profile completely: materially reduced infrastructure risk, no supply chain creation from scratch, and materially reduced industrial uncertainty at the manufacturing layer.
The remaining challenge is not greenfield industrial construction, but system adaptation, validation, certification alignment, and controlled manufacturing integration.
This is why the transition from air ionization infrastructure to power delivery infrastructure is not a new industrial category. It is a system-level upgrade built on an existing one.
Key Takeaways
Ready infrastructure
A substantial share of relevant production competencies is already present in the global ionizer industry, potentially covering a large proportion of the VENDOR.Max manufacturing stack.
Minimal capital requirement
Production launch estimated at $1–3M vs. $40–185M for greenfield manufacturing — a preliminary scenario estimate, subject to partner audit, certification scope, power class, and localization model.
Fast go-to-market
Base-case engineering adaptation phase 3–6 months vs. 2–3 years for conventional deep-tech hardware, contingent on certification scope and partner audit.
Massive addressable market
Reference scale across production base and target market context: $263B+ (air purification umbrella + site-autonomous infrastructure power).
Proven industrial model
The base grows 8–12% annually with stable demand across consumer and industrial segments. Production know-how, supplier networks, and certification pathways are already established at global scale.
For the investor, this means: access to infrastructure-level power technology — deployed through an existing industry, with a capital requirement and timeline that deep-tech hardware has rarely offered before. VENDOR.Max: validated at TRL 5–6. Patent: WO2024209235.
Frequently Asked Questions
Why does the ionization industry overlap with VENDOR's production requirements?
Both air ionization devices and VENDOR.Max site-autonomous power nodes share manufacturing competencies in controlled high-voltage discharge handling, insulation design, EMC-compliant enclosures, and HV safety architecture. This overlap is structural at the manufacturing competency level, which is why existing ionization production lines may be adaptable for VENDOR.Max without requiring greenfield factory construction.
How does VENDOR.Max's energy balance work?
A startup impulse initiates the operating regime, and regulated internal feedback maintains regime conditions. Complete device-boundary energy accounting remains applicable throughout operation and is governed by P_in,boundary = P_customer + P_losses + dE_stored/dt, which applies at the complete device boundary only (the eight-stage boundary-closure stage; internal stages have separate formulas — see How VENDOR.Max Works). The system does not produce energy from nothing and does not extract energy from air; air and gas serve only as an interaction medium for field dynamics, not as an energy source. It operates within classical electrodynamics as an open nonlinear resonant architecture — not a perpetual motion or over-unity device.
What is the current validation status of VENDOR.Max?
VENDOR.Max is validated at TRL 5–6 with over 1,000 cumulative operational hours, including a 532-hour continuous cycle under fixed load. The system holds a granted patent in Spain (ES2950176) and a PCT application (WO2024209235). Independent third-party verification is part of the planned validation pathway.
Is VENDOR building its own greenfield factory?
Not in the initial phase. The production strategy is based on adaptation of existing ionization-oriented manufacturing lines through OEM partnerships, licensing agreements, or joint ventures. Preliminary industrial assessment suggests the engineering adaptation phase may be achievable within a 3–6 month window — a scenario estimate subject to partner audit, certification scope, power class, and localization model.
What is the VENDOR addressable market?
VENDOR operates at the intersection of two market segments: the broader air purification industry as the industrial umbrella, with ionization-relevant subsegments as the directly relevant manufacturing base (projected at $53.35B by 2032), and the site-autonomous infrastructure power market (estimated at $210B+ by 2035). The reference scale across production base and target market context is $263B+. Serviceable obtainable market in a conservative scenario is estimated at $2.6–5.2B, subject to commercialization timeline and market conditions. All market figures are scenario-based context, not investment projections.
References and Technical Framework
Canonical reference covering breakdown, glow, arc, spark, and corona discharge regimes.
Principles of Plasma Discharges and Materials Processing, 2nd ed.
Primary reference for nonequilibrium plasma physics and industrial discharge processes.
Plasma Kinetics in Atmospheric Gases
Kinetic modeling of atmospheric gas discharges and nonequilibrium energy distribution.
Electricity in Gases
Foundational source for Townsend ionization framework and avalanche discharge theory.
"Electron swarm parameters and Townsend ionization coefficients of atmospheric corona discharge plasmas in air"
Townsend coefficients and transport parameters for atmospheric corona.
"Measurement of the first Townsend ionization coefficient in dry air"
Contemporary measurement data for Townsend coefficients in air.
"Transition from a corona to glow and to spark discharge in air at atmospheric pressure"
Regime transition analysis: corona → glow → spark.
"Inception threshold conditions for positive dc corona discharge in atmospheric pressure air"
Onset and inception dynamics for positive corona.
"Numerical modelling of negative corona discharges in air with experimental validation"
Current–voltage behavior and regime dependencies for negative corona.
"Trichel pulse in various gases and the key factor for its formation"
Self-pulsing behavior in corona discharge regimes.
"Glows, arcs, ohmic discharges: An electrode-centered review on discharge modes and the transitions between them"
Comprehensive modern review of discharge mode classification and transitions — directly relevant to regime boundary analysis.
"On 'relaxation-oscillations'"
Canonical source for limit-cycle oscillation and nonlinear damping theory.
Theory of Oscillators
Foundational reference for oscillatory regimes, stability analysis, and phase-plane methods.
Nonlinear Dynamics and Chaos, 2nd ed.
Primary reference for nonlinear regime behavior, bifurcations, limit cycles, and self-oscillation.
Synchronization: A Universal Concept in Nonlinear Sciences
Reference for coupled-oscillator logic, phase-locking, and synchronization phenomena.
CISPR 11:2024
RF emission requirements for ISM equipment including HV and discharge systems.
IEC 61000-4-2:2025
ESD immunity testing requirements for electrical and electronic equipment.
IEC 61000-4-18:2019
Oscillatory transient immunity testing relevant to HV switching environments.
IEC 61000-4-20:2022
TEM-based EMC testing methodology.
IEC 61010 family
Safety framework for HV and discharge-based measurement and control systems.
ISO 9001:2015
Production quality governance framework applied across ionization manufacturing supply chains.
Global Air Purifier Market — Size, Share and Forecast
Source for the air purification market sizing and CAGR figures cited in §03.
Aggregated ionization, plasma, and corona-segment market data
Subsegment figures (cold-plasma, smart purifiers, ozone generators, ionizing blowers, negative-ion generators) are aggregated for contextual illustration and are not investment projections.