Endurance Validation · Empirical Evidence · TRL 5–6

Endurance Test — 1,000+ Hours of Empirical Answer

Boundary-level operation under sustained load. The architecture is evaluated through measurement.

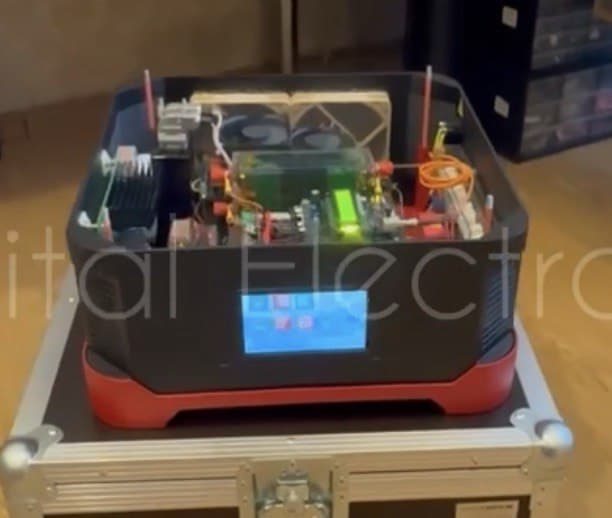
VENDOR.Max is an Armstrong-type nonlinear electrodynamic oscillator operating in a controlled discharge-resonant regime. This page documents the empirical answer to the central engineering question: does the regulated feedback path provide sufficient contribution within the boundary-accounted system to maintain the operating regime under sustained real-load conditions, while the load path simultaneously delivers rated power?

A prototype unit was evaluated under controlled laboratory conditions using a black-box boundary measurement protocol. Measurement was referenced at two externally accessible electrical interfaces — the ignition port (discrete startup event, then electrically isolated per patent claim 1) and the customer AC interface (outbound delivered-energy reference). Pre-commercial validation stage at TRL 5–6.

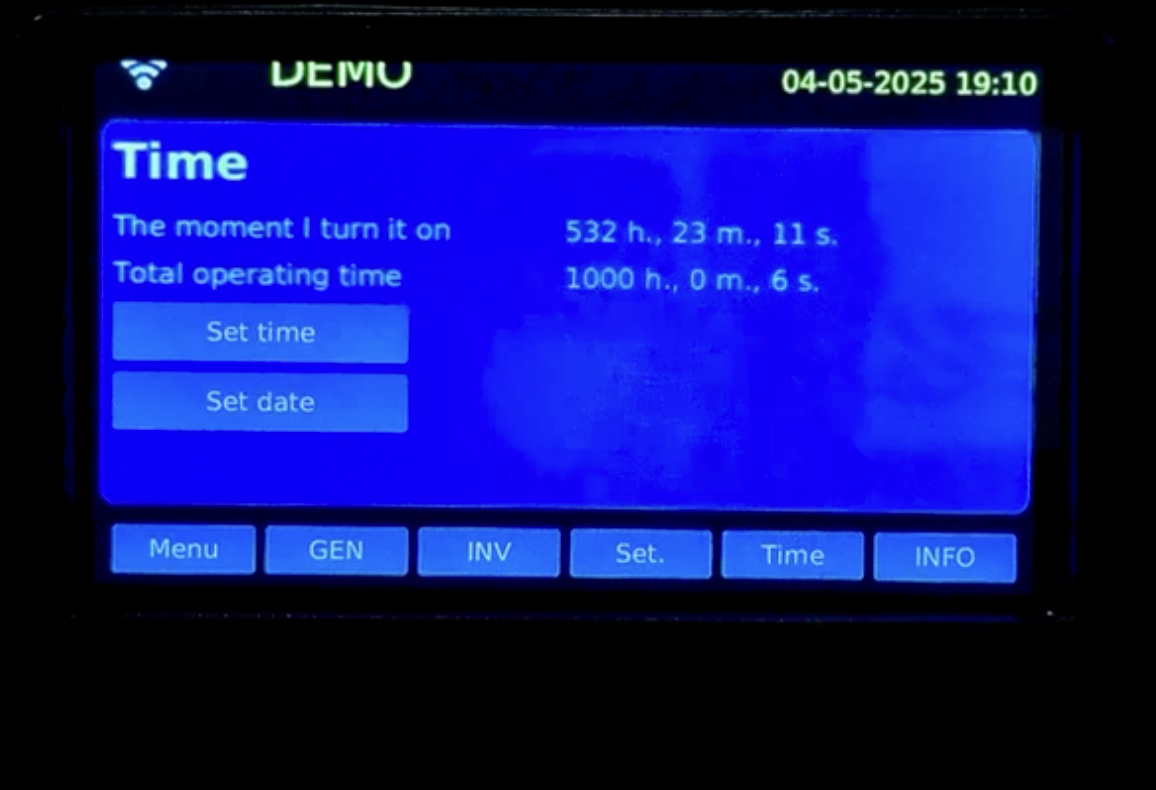
The prototype maintained a stable operating regime for more than 1,000 hours of cumulative runtime, including 532 hours of sustained operation at a fixed 4 kW load. Approximately 4 MWh of cumulative delivered energy was observed under validation-stage measurement at the customer AC interface, within calibration tolerance. No critical degradation was observed across the disclosed validation window.

Cumulative Runtime
1,000+ h
Across multiple test configurations
Sustained Segment
532 h @ 4 kW
Sustained fixed-load operation
Delivered Energy
~4 MWh
Across the disclosed validation window
Output Interface
220 V / 50 Hz
Customer AC delivery
Validation Stage
TRL 5–6
Pre-commercial validation
Empirical-Evidence Page Validation-Stage Measurement Black-Box Boundary Protocol TRL 5–6
Patents: ES2950176B2 (granted, Spain) · WO2024209235 (PCT). Plus regional examination: EP, US, CN, IN. MICRO DIGITAL ELECTRONICS CORP S.R.L., Romania, EU.
01 · Central Engineering Question · What This Test Answers

The Question. And the Empirical Answer.

Endurance testing is not a generic “how long the device runs” measurement. It is the empirical answer to a specific physical question posed by the architecture.

Central Engineering Question · Architecture-Specific

“Does the regulated feedback path provide sufficient contribution within the boundary-accounted system to maintain the operating regime under sustained 4 kW load, while the load path simultaneously delivers rated power, across extended real-load conditions, after disconnection of the 0.015 Wh startup impulse at the ignition port?”

This question is documented in the architecture description (How It Works), in the four-validation-bottlenecks engineering self-disclosure, and analyzed stage-by-stage with full literature anchors in the dedicated First Open Engineering Question in VENDOR.Max article. The regulated feedback path operates at regime level — its function is to redistribute energy within the formed regime, event by event, to maintain operating continuity. Whether this redistribution remains sufficient under sustained real load — within the boundary-accounted system — while the load path simultaneously delivers rated power, is the central engineering question.

At the complete device boundary (Level 1 of the Three-Level Energy Model reference), classical energy conservation applies at all operational states: Pin,boundary = Pcustomer + Plosses + dEstored/dt. Pin,boundary is the aggregate Level-1 accounting term at the complete device boundary — not a topology statement and not a designation of any specific port as a continuous external feed. Internal stages of the architecture are governed by stage-specific equations within the eight-stage architecture documented at How VENDOR.Max Works.

At regime level (Level 2 of the Three-Level Energy Model reference), the question is whether the regulated feedback path coordinates event-by-event redistribution sufficiently for the regime to persist under sustained load extraction at the load path. This page documents the empirical answer observed across 1,000+ hours of cumulative runtime, including a 532-hour sustained segment at 4 kW. The answer applies within the disclosed validation window and within the defined load-compatible operating envelope.

02 · Engineering Classification · Established Framework

This Is Established Engineering. Not New Physics.

The VENDOR.Max architecture belongs to a recognized engineering class that has been studied, published, and engineered for decades. The classification is supported by patent examiners, standard textbooks, and established conference frameworks.

Engineering Category

Impulse Discharge Architecture · Spark-Gap-Based Pulse Formation

VENDOR.Max is classified as an Armstrong-type nonlinear electrodynamic oscillator operating in a controlled discharge-resonant regime — within the broader engineering class of impulse-discharge architectures using spark-gap-based pulse formation. This engineering category has existed in the literature for decades and is recognized as an established industrial topology within classical Maxwell–Lorentz electrodynamics.

Reference Frameworks

Established Conference & Literature

Standard reference frameworks for this engineering class:

  • IEEE PPC (Pulsed Power Conference)
  • International Pulsed Power Conference
  • Raizer, “Gas Discharge Physics” (1991), Springer
  • Lieberman & Lichtenberg, “Principles of Plasma Discharges” (2005), Wiley
IPC Classification · External Validation

Patent Examiner Classification

International Patent Classification (IPC) codes assigned by patent examiners during prosecution — not self-declared by the applicant:

  • H03K 3/537 (narrowest): pulse formation via spark-gap-controlled discharge path
  • H02M 3/00–3/335
  • H02M 7/00–7/06
  • H02P 13/00
  • H02J 7/00–7/50
Anchor · Established Engineering Class

The narrowest IPC code, H03K 3/537, describes the relevant impulse-formation class: a storage element discharged through a spark-gap-controlled discharge path. In the VENDOR.Max architecture, this classification relates to pulse formation inside the active regime path, not to the customer AC load interface. This is a recognized engineering category, not a novel physical claim. The patent examiners’ classification serves as external validation that the architecture fits within established taxonomy of impulse electronics.

The remaining sections explain the Three-Level energy framework (Section 03), the measurement protocol with critical port clarification (Section 04), the architecture under test (Section 05), the EMI/EMC architecture relevant for telecom deployment (Section 06), the numerical bridge from event-level dynamics to continuous power (Section 07), the endurance record itself (Section 08), the regime stability envelope (Section 09), and the scope boundaries of what this test confirms (Section 10).

03 · Three-Level Energy Model · Mandatory Scale Separation

Three Levels. Never Collapse Them.

The system must be interpreted at three strictly separated analytical levels, each with its own physical scale, units, and governing equations. Major misinterpretations arise when these levels are collapsed into a single formalism. Endurance test data must be read through all three levels — never one alone.

Level 1

Macroscopic Boundary Accounting

Complete device boundary, macroscopic scale. Classical conservation applies at all operational states.

  • Boundary-crossing flows are bookkeeping terms aggregated across the outer enclosure
  • P_in,boundary is an accounting quantity, not a topology designation
  • Whole-device performance is not reduced on this page to a simplified efficiency ratio; the canonical frame is complete boundary accounting and boundary-residual closure
P_in,boundary = P_customer + P_losses + dE_stored/dt

Closure is to be verified empirically by the boundary residual tending to zero within accredited measurement uncertainty under independent third-party metrology — the explicit pre-commercial validation milestone (TRL 6).

Level 2

Per-Event Partition · Regime Domain

Within the formed regime, energy is structured event-by-event. Each discharge cycle is a discrete energetic event.

  • Per-event energy is bounded by capacitive storage at the regime nodes
  • Parallel Faraday induction at the primary resonant frequency of 2.45 MHz partitions E_event across the regulated feedback path and the load path
  • Regime stability is described through regime-domain coefficients — never through boundary efficiency ratios
P_avg = E_event · f · N

The bridge equation reconstructs continuous power from event-level quantities; closure with Level 1 requires summing parallel paths and accounting for per-stage losses.

Level 3

Gap-Internal Carrier Dynamics

Inside the sealed nonlinear conductivity cells, classical pre-breakdown physics governs carrier transport in the Townsend regime.

  • Carrier density evolves exponentially along the gap under Townsend multiplication
  • α is the first Townsend coefficient (1/m), dependent on field and gas state
  • Microscopic mechanism inside the sealed cell is proprietary; class-level physics is documented in standard plasma-discharge literature
n(x) = n_0 · exp(α · x)

Townsend multiplication multiplies carrier count — a dimensionless quantity. It does not multiply energy. Per-event energy at Level 2 remains bounded by capacitive storage.

Transformer Analogy · Seal Point

“A transformer’s secondary winding can deliver more current than its primary, while voltage drops in the same ratio. The local current ratio is greater than one; the device-boundary power balance remains governed by classical conservation. Local ratios describe redistribution between sub-blocks; the boundary describes conservation. Cross-level statements — comparing a Level-1 macroscopic quantity to a Level-2 event-partition quantity or a Level-3 carrier-multiplication factor — are category errors.”

Endurance-Specific Interpretation Note

Endurance test results must be read through all three levels. Runtime persistence — 1,000+ hours cumulative regime runtime, 532 hours sustained at 4 kW — describes Level 2 behavior: the persistence of the formed regime under sustained load extraction, event-by-event, under regulated feedback. Delivered energy — ~4 MWh cumulative across the disclosed validation window, including 2.128 MWh delivered during the 532 h × 4 kW sustained segment — is the bookkeeping quantity at Level 1: the customer-side outbound flow referenced at the AC interface. The question of how Level 2 regime sustainment closes against Level 1 boundary accounting — including independent characterization of all boundary-crossing flows at the complete device boundary under accredited third-party metrology — is the explicit next milestone of the pre-commercial validation programme. Conflating runtime (Level 2) with delivered energy (Level 1), or assuming the boundary equation describes any single internal stage, is a category error.

04 · Black-Box Boundary Protocol · Measurement Framework

Two Boundary Interfaces. Two Distinct Functions.

The test was conducted under a black-box boundary measurement protocol — a methodology where system boundaries are defined exclusively by external electrical interfaces, with no internal circuit measurements included in the validation summary. The boundary has two interfaces, each with a distinct function. Their roles must be read separately.

Interface 1

Ignition Port — Startup Interface, Disconnected After Regime Initiation

The ignition port carries a low-energy startup impulse used to establish the initial conditions of the operating regime. The startup sequence is defined as: 9 V battery source, ~15 seconds duration, startup energy ≈ 0.015 Wh.

After successful regime ignition, the startup source is physically disconnected from the ignition path per patent claim 1. The ignition port plays no further role during the sustained operation interval.

Interface 2

Customer AC Interface — Output Delivery Reference

The customer AC interface is the externally accessible electrical interface where delivered power is referenced. During sustained operation, output is delivered through this interface to the external load at 220 V / 50 Hz. This is also the reference point at which delivered-energy bookkeeping is observed under the validation-stage measurement protocol.

P_in,boundary is the aggregate Level-1 accounting term at the complete device boundary across the operating interval — an accounting quantity, not a topology designation of any specific port as a continuous external feed. Closure of the boundary equation, including independent characterization of all boundary-crossing flows, is to be verified by accredited third-party metrology (TRL 6 milestone).

Arithmetic Check · Foreclosing the Naive Ratio Reading

A common misreading frames the test as a simple single-port ratio: 0.015 Wh in, 2,128 kWh out, declared overunity. The arithmetic dimensional check makes this reading invalid before any measurement begins:

532 hours × 4 kW = 2,128 kWh of delivered energy. The startup impulse was 0.015 Wh (one-time transient at ~9 V over ~15 s, ignition port disconnected per patent claim 1). These quantities differ by a factor of approximately 1.4 × 10^8.

These are different categories of physical quantity. The startup impulse is a Level-1 boundary-crossing event of fixed energy at the ignition port. The 2,128 kWh is sustained customer-delivered energy integrated over Level-2 regime persistence. Comparing them through a single-port input/output ratio is a category error.

VENDOR.Max prototype unit during endurance test preparation — open configuration showing internal electrodynamic architecture before sealed black-box testing
VENDOR.Max prototype unit. Internal architecture visible during pre-test configuration stage. Endurance test conducted in sealed black-box configuration.
Laboratory Configuration · Two Physically Separate Units

Test Unit & Setup Unit

The laboratory setup included two physically separate units: the Test Unit (the device under endurance evaluation, operated in sealed black-box configuration; all reported measurements correspond exclusively to this unit) and the Setup Unit (used exclusively for parameter adjustment and preliminary configuration; not part of the endurance record). No electrical power, control signal, or energy transfer was present between the units during the endurance interval. This separation is standard laboratory practice in nonlinear electrodynamic systems.

05 · Architecture Under Test · Two Functional Paths

Two-Path Functional Architecture with Three Resonant Winding Circuits

The patent (ES2950176, WO2024209235) describes a discharge-resonant architecture grouped at the functional level into two paths, with three resonant winding circuits at the patent-component level. Two patent-disclosed claims define the operational anchors:

Patent-Disclosed Claims · Architecture Anchors
  • Claim 3: flat primary winding with 2.45 MHz primary resonance
  • Claim 5: three parallel spark gaps with overlapping but shifted frequency spectra
Regime-Forming Path · Functional Level

Active Core — Regime Formation

  • Storage capacitors (C2.1, C2.2, C2.3)
  • Discharge arrester unit (nonlinear active element): three parallel spark gaps with overlapping but shifted spectra
  • Primary winding (4) of transformer (5)
  • Forms a pulsed electromagnetic field
Resonant Frequency: 2.45 MHz (Claim 3)
Output-Extraction Path with Feedback · Functional Level

Feedback Path & Load Extraction

  • Electromagnetically coupled to the regime-forming path through transformer (5)
  • Regulated feedback path: maintains the capacitive node between discharge events (secondary winding (7) → rectifiers (17, 18, 19) → BMS / buffer control layer → storage capacitors C2.1–C2.3)
  • Load path: delivers power to external load (tertiary winding (10) → rectifier (12) → external load)
  • BMS coordinates feedback path priority over load path

The regulated feedback path operates at regime level (Level 2 — per-event partition). At the complete device boundary (Level 1), this internal redistribution is not a boundary-crossing flow and does not appear as a term in P_in,boundary.

Patent-Component Layer · Three Resonant Winding Circuits
Primary Winding (4)
Regime Resonant Circuit

With capacitor (6) at 2.45 MHz (Claim 3). Forms the operating regime.

Functional grouping: Regime-forming path
Secondary Winding (7)
Feedback Resonant Circuit

With capacitor (8). Output rectified through rectifiers (17, 18, 19) and routed back to storage capacitors. Priority 1 — regime stability.

Functional grouping: Output-extraction path
Tertiary Winding (10)
Load Resonant Circuit

With capacitor (11). Feeds load (13) through rectifier (12). Priority 2 — receives allocation only after regime stability is satisfied.

Functional grouping: Output-extraction path
Interaction Medium

Air/gas in the spark gaps functions as the interaction medium — not as an energy source. The field is the mediator that structures energy transfer within the formed regime. The field performs work on accelerated carriers; the working medium serves as the carrier reservoir.

Physics Mechanism · Townsend Avalanche

Inside the spark gaps, gas ionisation is governed by Townsend avalanche carrier multiplication: n(x) = n_0 · exp(α · x). The nonlinear discharge dynamics are evaluated at regime level through per-cycle behavior and loss structure. The endurance result shows observed regime persistence under sustained load within the disclosed validation window; complete closure against Level-1 boundary accounting remains part of the TRL 6 third-party metrology milestone.

06 · EMI/EMC Architecture · Telecom-Compatible Design

2.45 MHz Resonance — Without the Microwave Problem.

Standard engineering intuition expects an impulse architecture operating at 2.45 MHz primary resonance to produce significant electromagnetic radiation. Impulse circuits in the MHz-range RF band, near the MF/HF boundary, typically require careful field-management because materials couple to RF energy in this range. The first reasonable question from any engineer is therefore: does VENDOR.Max radiate?

Frequency Disambiguation · MHz Is Not GHz

The 2.45 MHz primary resonance is three orders of magnitude lower than the 2.45 GHz ISM band used by microwave ovens. These are different coupling regimes and must not be conflated:

  • 2.45 MHz (MHz-range RF band, near the MF/HF boundary): used in industrial RF applications; coupling regime appropriate for this range differs from microwave coupling
  • 2.45 GHz (microwave band): used by microwave ovens for water-molecule dielectric heating

The relevant engineering question for VENDOR.Max is therefore RF emission containment in the 2.45 MHz RF range, not microwave coupling. The architecture and the empirical evidence below address this specific RF-range question.

Standard Expectation

MHz-Range RF Impulse Systems — Field Management Required

Conventional architectures with impulse discharges in the 2.45 MHz RF range would produce significant electromagnetic radiation outside the device. For a power node intended for co-location with telecom equipment, this would be a deployment-blocking issue: telecom installations require electromagnetic compatibility under the CE EMC Directive 2014/30/EU and GSMA radiation-environment standards.

A device that radiates at MHz-range frequencies cannot be installed near antenna systems, base-station electronics, or sensitive measurement equipment without compliant emission containment.

VENDOR.Max Architecture

Why It Is Different — Field-Confinement Engineering

The engineering implementation of the primary winding (4) and the mechanical compounding of the resonant structure are designed to localize the electromagnetic field inside the resonant coupling between the three winding circuits — primary (4), secondary (7), and tertiary (10). The radiation pattern is contained within the device boundary by the engineering realization of the resonant topology, not by external shielding alone.

This is one of the engineering choices protected as know-how at TRL 5–6, alongside the specific construction of the discharger unit and the phase-alignment methodology between the three resonant circuits. Patent ES2950176 / WO2024209235 specifies the architectural topology; the engineering realization that achieves field confinement is consciously undisclosed in public materials at the current validation stage. This is standard deep-tech IP practice.

Empirical Evidence · Internal Spot Measurements

Spot measurements were performed in close proximity to the operating prototype during the endurance interval, using handheld monitoring instruments:

  • Instrument Reading Reference Range Status
  • SOEKS Quantum · dosimeter 0.13 µSv/h Natural background 0.10–0.30 µSv/h Within range
  • MEGEON EMF meter 0.34 µT Typical indoor ambient level Within range
VENDOR.Max safety monitoring — SOEKS Quantum dosimeter and MEGEON EMF meter spot measurements during prototype endurance test
Spot measurements performed in close proximity to the VENDOR.Max prototype during endurance operation. Instruments: SOEKS Quantum · MEGEON EMF meter.

Why This Matters · Telecom Co-LocationField-Confinement Architecture as Deployment Constraint

The target deployment context for VENDOR.Max includes remote telecom towers, base-station sites, and infrastructure-grade installations. EMI/EMC compatibility is a categorical requirement in these environments — not a refinement. Field-confinement engineering is therefore one of the central engineering constraints that defines deployment viability for the target audience. The empirical evidence to date — internal spot measurements within ambient range during operation — did not indicate elevated readings at the measured points. Independent accredited EMI/EMC measurement is the next milestone.

07 · Numerical Bridge · From Events to Power

Million-Cycle Integration. Standard Electrodynamics.

Endurance results — 4 kW sustained output over 532 hours — derive from the integration of millions of small discharge events per second through a standard event-level / power-level bridge. The arithmetic is simple and standard for pulse-power systems.

Event-Level Energy Distribution

Internal Redistribution Per Discharge Event

E_extract,event = E_customer,event + E_fb,event + E_loss,conv,event
Notation footnote (canonical clarification): E_extract,event denotes energy coupled into the internal extraction path within the formed regime. It is a Level 2 (per-event partition) allocation term, related to Level 1 macroscopic accounting through the bridge equation below. It does not imply energy extraction from air, gas, or the environment.

Per single discharge event, energy is internally distributed across three functional paths within the same device boundary: customer-side delivery, regime-feedback redistribution, and conversion losses. This is a Level 2 (per-event partition) accounting equation — it describes intra-cycle internal redistribution, not boundary-level input.

Bridge from Event Level to Continuous Power

Average Power as Event Energy Times Frequency

P_x,avg = E_x,event · f · N

Canonical bridge equation per the Three-Level Energy Model reference: f = event repetition rate, N = parallel event paths within the eight-stage architecture.

For order-of-magnitude estimation at the regime aggregate level, treating discharge events as a single combined stream at the primary resonant frequency f = 2.45 MHz (single-equivalent form, N = 1) and sustained customer-delivered power P_customer = 4 kW, the corresponding event-level customer-delivery energy is:

E_customer,event ≈ P_customer / f = 4000 W / (2.45 × 10^6 Hz) ≈ 1.63 mJ per event
Verifiable Arithmetic
4000 / (2.45 × 10^6) = 1.633 × 10^-3 J = 1.633 mJ. This is a single-equivalent order-of-magnitude estimate of customer-side event allocation; when such allocations are integrated over millions of regime cycles per second, they correspond to the 4 kW average power referenced at the customer AC interface.
Reference Framework
This relation appears in standard textbooks on pulsed power and plasma discharges (Raizer 1991, Lieberman & Lichtenberg 2005). It is not a novel claim — it is a standard discipline of distinguishing scales: microscopic event dynamics versus macroscopic boundary balance. Conflating the two scales without applying the bridge produces order-of-magnitude reading errors. Stage-by-stage literature integration for the full architecture is documented in the dedicated First Open Engineering Question in VENDOR.Max article.
How This Explains the Endurance Data

1,000+ hours of cumulative regime runtime corresponds to integration of approximately f × t = 2.45 × 10^6 × 3.6 × 10^6 ≈ 8.8 × 10^12 regime cycles per 1,000 hours of operation. In the single-equivalent estimate, each cycle corresponds to ~1.6 mJ of customer-side allocation at 4 kW sustained customer load; the macroscopic 4 kW sustained output at the customer AC interface is the integration of these cycles over time. Level 1 macroscopic accounting is referenced at the customer AC interface; complete closure of the boundary equation, including independent characterization of all boundary-crossing flows, is to be verified by accredited third-party metrology (TRL 6 milestone).

08 · Endurance Record · Validation-Stage Measurement at TRL 5–6

1,000+ Hours. ~4 MWh Delivered.

The system has been operated under real load conditions during validation-stage measurement at TRL 5–6. These observations describe regime persistence and load-capable operation across extended duration, within calibration tolerance. The numbers below describe one defined endurance-validation campaign under the disclosed protocol — they do not represent certified output performance.

Cumulative Regime Runtime
1,000+ h
Across multiple test configurations
Sustained Load Segment
532 h @ 4 kW
Sustained fixed-load operation
Sustained-Segment Delivered
2.128 MWh
532 h × 4 kW
Cumulative Delivered Energy
~4 MWh
Across the disclosed validation window
Critical Degradation
No critical degradation observed
Within the disclosed window
Observed Stability Metrics
  • Parameter Observed Stability
  • Voltage Stable within the nominal AC interface regulation range
  • Frequency Stable within the nominal AC interface frequency range
  • Output Power Stable operation under constant load
  • Total Regime Runtime 1,000+ hours cumulative
  • Sustained Load Segment 532 hours sustained at fixed 4 kW
  • Sustained-Segment Energy Delivered 2.128 MWh
  • Cumulative Delivered Energy ~4 MWh across the disclosed validation window, including the 532 h sustained segment at 4 kW
  • Critical Degradation No critical degradation observed within the disclosed validation window
VENDOR.Max endurance test — monitor display confirming total regime runtime and load-specific operation hours during laboratory validation
Monitor display captured during the endurance test record. Confirms cumulative regime runtime and load-specific operation intervals.
Interpretation Note

These observations describe regime persistence and load-capable operation across extended duration within the tested load configuration, within calibration tolerance. They do not, by themselves, constitute full boundary-level energy balance verification. All measurements were performed under the black-box boundary measurement protocol described in Section 04. Pre-commercial validation stage at TRL 5–6. Independent verification at the customer AC interface and ignition port under accredited metrological protocol is the next pre-commercial validation milestone.

Output Interface Parameters
  • Voltage220 V RMS
  • Frequency50 Hz
  • Load ModeDefined-load operating point (programmable electronic load)
09 · Regime Stability Envelope · Bounded Operation

Stability Within Bounded Envelope. Not Across Arbitrary Load.

The operating behavior of the VENDOR.Max system is defined by a load-dependent stability envelope characteristic of nonlinear electrodynamic regimes. Stability is observed only within a bounded regime-compatible operating range. This bounded behavior is typical for nonlinear resonant systems and does not imply arbitrary scalability.

Condition 01

Upper Stability Threshold

If the regime is configured for ~4.8 kW (modular configuration based on 2.4 kW blocks), operation remains stable up to that threshold. Loading the system above this level (e.g., 5 kW) leads to immediate regime collapse in fixed-regime-mode configuration.

Condition 02

Lower Configuration Stability

If the regime is configured for a lower level (e.g., 2.4 kW), exceeding that level results either in regime collapse or in protective shutdown, depending on the specific configuration.

Condition 03

Sub-Threshold Operation

If the applied load remains below the configured regime level (e.g., 1 kW load with a 2.4 kW regime configuration), the system maintains the established regime for extended periods within that bounded operating condition. Internal regime-feedback redistribution sustains regime coherence under fixed load conditions, limited by internal losses, component stability, and degradation over time.

Tested Operating Point · Within Stability Envelope

532-Hour Sustained Segment at 4 kW

The 532-hour sustained segment was conducted at 4 kW within a regime configuration with an upper stability threshold of approximately 4.8 kW. The applied load remained well within the predefined stability envelope for the entire duration. The endurance test was intentionally conducted below the upper stability threshold to ensure long-duration regime persistence under controlled operating conditions.

The specified upper threshold of 4.8 kW reflects a regime stability boundary under the given configuration. It is not a certified output rating, maximum capacity, or continuous operating specification. Certified ratings are defined at the CE/UL certification stage at TRL 8.
Fixed-Regime Mode vs. Buffered Mode

Scope of This Endurance Record

The endurance record on this page describes fixed-regime-mode operation (without the Buffer engaged as an active storage layer) under fixed load. In buffered-mode configuration, the BMS (Boundary Management System, the supervisory controller) coordinates the Buffer (the bidirectional storage layer it supervises) to enable dynamic load adaptation and transient-peak compensation within defined protection limits. Buffered-mode operation represents a different deployment configuration; its characterization is not included in this endurance record.

10 · Validation Conclusions · Scope-Bounded

What Is Confirmed. What Requires Independent Verification.

Validation evidence is presented in two scope-bounded columns: confirmed by validation-stage measurement at TRL 5–6, and pending pre-commercial verification under accredited metrological protocols.

Confirmed by Validation-Stage Measurement
  • Patent-defined two-path functional architecture (regime-forming path + output-extraction path with feedback) with three resonant winding circuits; validation-stage operation observed under sustained load [Patent: ES2950176 · PCT: WO2024209235]
  • Regime formation and stability under real load
  • Regime persistence over extended duration, consistent with the architecture-defined feedback function at regime level (Level 2)
  • Load delivery through tertiary winding path (220 V / 50 Hz)
  • Cumulative regime runtime: 1,000+ h (Level 2)
  • Sustained load segment: 532 h @ 4 kW (Level 2)
  • Cumulative delivered energy: ~4 MWh observed at the customer AC interface within calibration tolerance, across the disclosed validation window (Level 1, validation-stage measurement)
  • No critical degradation observed within the disclosed validation window
  • EMF measurements within ambient range during operation (SOEKS Quantum 0.13 µSv/h, MEGEON EMF 0.34 µT)
Pre-Commercial Validation Pathway
  • Boundary-level energy balance closure (Level 1) under sustained real-load operation, with independent instrumentation at the customer AC interface and ignition port under accredited metrological protocol
  • Full accounting at the complete device boundary: P_in,boundary, P_customer, P_losses, dE_stored/dt, all measured independently with accredited instrumentation
  • EMI/EMC compliance measurement (CE EMC Directive 2014/30/EU) at accredited laboratory at TRL 8
  • Independent verification by qualified third-party laboratory under standard IEC / IEEE measurement frameworks
  • CE / UL certification milestones at TRL 8
Position in Validation Pathway

TRL 5–6 — Internal Validation Milestone

This endurance record represents the internal validation milestone within the TRL 5–6 stage. It answers the regime persistence question — a foundational engineering criterion before independent verification and certification engagement is initiated. The progression sequence:

  • 01 Internal regime stability testing (this page) Completed
  • 02 Testing in accredited laboratories In Preparation
  • 03 CE certification procedures In Preparation
  • 04 UL certification procedures In Preparation
  • 05 Independent engineering validation (DNV / TÜV) Planned
  • 06 Pilot field deployment Following Accredited Verification
Direct Answers · Structured Clarity

Five Direct Answers to Five Direct Questions.

Direct, scope-bounded answers to the five most common engineering questions about the endurance test — written for fast technical reading and consistent interpretation.

Q1

What does the endurance test prove?

Verdict · Regime persistence under load

The endurance test confirms that the VENDOR.Max prototype maintains a stable nonlinear electrodynamic operating regime under sustained electrical load for over 1,000 hours of cumulative runtime, including a 532-hour sustained segment at 4 kW. ~4 MWh of cumulative delivered energy was observed at the customer AC interface, within calibration tolerance. Pre-commercial validation stage at TRL 5–6.

Q2

Was external electrical power applied at the complete device boundary during the 532-hour sustained segment?

Verdict · Startup impulse only

The ignition port received a one-time startup impulse (~9 V × ~15 s ≈ 0.015 Wh) initiating the regime per patent claim 1, and was then physically disconnected. The customer AC interface was operationally active throughout the sustained segment as the load delivery interface at 220 V / 50 Hz. The energy-origin question at the complete device boundary — the canonical accounting identity P_in,boundary = P_customer + P_losses + dE_stored/dt — is the subject of the dedicated Where Does the Energy Come From page; complete closure of this identity under independent third-party metrology is the TRL 6 milestone.

Q3

Why is 532 h × 4 kW not comparable to the 0.015 Wh startup impulse?

Verdict · Startup is initiation, not the source

The arithmetic ratio between 2,128 kWh of delivered energy and 0.015 Wh of startup impulse is approximately 1.4 × 10^8. Framing the comparison as "0.015 Wh produced 2,128 kWh" misidentifies the role of the startup impulse: per patent claim 1, the impulse initiates the electrodynamic regime and the ignition port is then disconnected — it is an initiation event, not the source of sustained delivery. The energy-origin question — where the sustained 4 kW at the customer AC interface is accounted for at the complete device boundary — is the subject of the dedicated Where Does the Energy Come From page and the First Open Engineering Question in VENDOR.Max article. The canonical accounting identity P_in,boundary = P_customer + P_losses + dE_stored/dt is referenced at the complete device boundary; complete closure of this identity under independent third-party metrology is the TRL 6 milestone.

Q4

Why is event-level energy (~1.6 mJ) compatible with sustained 4 kW?

Verdict · Event integration at 2.45 MHz

At operating frequency f = 2.45 MHz and sustained customer-delivered power P_customer = 4 kW, taking the simplified single-equivalent-stream form (N = 1 effective) for order-of-magnitude estimation, the event-level customer-delivery energy is E_customer,event ≈ P_customer / f ≈ 1.63 mJ per event. The macroscopic 4 kW sustained output at the customer AC interface is the integration of these single-equivalent regime cycles over time. This is a standard scale-distinguishing relation in pulse-power literature (Raizer 1991, Lieberman & Lichtenberg 2005). Conflating event energy with sustained power produces order-of-magnitude reading errors. The bridge equation operates at the regime side of the Eight-Stage Architecture; the patent claim-1 schematic describes the regime-side stages, and the downstream output conditioning stage (rectifier → inverter → output filter) that references the regime output to the customer AC interface at 220 V / 50 Hz is a separate stage not represented in the patent claim-1 schematic.

Q5

Does the system radiate at 2.45 MHz?

Verdict · Engineering constraint; ambient-range spot readings

Standard expectation for impulse architectures at 2.45 MHz would be significant electromagnetic radiation. Field-confinement engineering is therefore one of the central engineering constraints in the implementation of the primary winding (4) and the resonant topology between the three winding circuits. Internal spot measurements during the endurance interval: SOEKS Quantum at 0.13 µSv/h (natural background range), MEGEON EMF meter at 0.34 µT (typical indoor ambient level), close to the operating prototype — did not indicate elevated readings at the measured points. The field-confinement implementation is protected as know-how at TRL 5–6. Independent accredited EMI/EMC measurement is part of the CE certification milestone at TRL 8.

FAQ · Technical Clarity

Frequently Asked, Precisely Answered.

Seven canonical questions on the endurance test record — answered through the boundary-accounting framework, scope-bounded to the disclosed validation window.

01 What does the 1,000+ hour endurance test prove?

The test confirms that the VENDOR.Max prototype maintains a stable nonlinear electrodynamic operating regime under sustained electrical load for over 1,000 hours of cumulative runtime. Within this period, operation at 4 kW was sustained for 532 hours, with ~4 MWh of cumulative delivered energy observed at the customer AC interface across the disclosed validation window. This is a TRL 5–6 internal validation result. Independent verification at the customer AC interface and ignition port under accredited metrological protocol is the next pre-commercial validation milestone.

02 How does the boundary protocol define the measurement interfaces?

The black-box boundary measurement protocol distinguishes two physical interfaces: (1) the ignition port — used only for the one-time startup impulse (~9 V × ~15 s ≈ 0.015 Wh), then physically disconnected per patent claim 1; and (2) the customer AC interface — operational output where load delivery is referenced at 220 V / 50 Hz. The canonical accounting identity at the complete device boundary, P_in,boundary = P_customer + P_losses + dE_stored/dt, is referenced as an accounting quantity at Level 1 (macroscopic boundary accounting); complete closure of this identity under independent third-party metrology is the TRL 6 milestone.

03 How can sustained 4 kW operation be consistent with event-level energies of ~1.6 mJ?

At operating frequency f = 2.45 MHz, taking the simplified single-equivalent-stream form, the event-level customer-delivery energy is E_customer,event ≈ P_customer / f = 4000 W / (2.45 × 10^6 Hz) ≈ 1.63 mJ per event. The macroscopic 4 kW sustained output at the customer AC interface is the integration of approximately 2.45 million regime cycles per second. The canonical bridge equation (P_x,avg = E_x,event · f · N per the Three-Level Energy Model reference) is standard for pulse-power systems. Without applying this bridge, comparing milli-joules per event with kilowatts of sustained output produces order-of-magnitude reading errors. The bridge operates at the regime side; the downstream output conditioning stage (rectifier → inverter → output filter) that references the regime output to the customer AC interface at 220 V / 50 Hz is a separate stage not represented in the patent claim-1 schematic.

04 Why is the boundary defined at the complete device level — what about internal processes?

Boundary-level accounting (Level 1, macroscopic boundary) is referenced at the complete device boundary through the canonical accounting identity: P_in,boundary = P_customer + P_losses + dE_stored/dt. Internal processes — regime-forming path, output-extraction path with feedback, BMS/Buffer supervision, discharge dynamics — operate at regime level (Level 2, per-event partition) and gap level (Level 3, gap-internal carrier dynamics). Local ratios at regime level describe redistribution between sub-blocks; they do not redefine the boundary accounting identity. Drawing the measurement boundary around an internal sub-block instead of the complete device produces a boundary-definition artifact, not a physics phenomenon.

05 Does the system radiate at 2.45 MHz given the impulse discharge regime?

The 2.45 MHz primary resonance would, in conventional impulse architectures, produce significant electromagnetic radiation. Field-confinement engineering of the primary winding (4) and the resonant topology between the three winding circuits is one of the central engineering constraints in the VENDOR.Max implementation. Internal spot measurements during the endurance interval — SOEKS Quantum at 0.13 µSv/h (natural background range) and MEGEON EMF meter at 0.34 µT (typical indoor ambient level) — did not indicate elevated readings at the measured points. Independent accredited EMI/EMC compliance measurement is part of the CE certification milestone at TRL 8.

06 Can the system operate at any load, or is stability load-dependent?

Stability is load-dependent. The system maintains operation only within a bounded regime-compatible operating range — the regime stability envelope. The 532-hour sustained segment was conducted at 4 kW within a regime configuration with an upper stability threshold of approximately 4.8 kW. Loading above the configured threshold leads to regime collapse in fixed-regime-mode configuration. This bounded behavior is typical for nonlinear resonant systems and does not imply arbitrary scalability — bounded stability within a defined envelope, not unrestricted operation across arbitrary load levels.

07 What does this test record represent — and what does it not?

This page documents regime persistence under sustained load conditions, observed within the black-box boundary measurement protocol at pre-commercial validation stage TRL 5–6. It does not establish certified energy efficiency, accredited safety compliance, EMI/EMC certification, or commercial readiness. Internal mechanism interpretation remains subordinate to boundary-level measurement. Independent verification under accredited laboratory protocols and CE / UL certification at TRL 8 are the next milestones in the pre-commercial validation pathway.

Related Technical Pages · Knowledge Cluster

Continue Reading. Connected Technical Pages.

Six canonical pages that together form the doctrinal cluster of the VENDOR.Max architecture and validation framework. Read together for full context on the endurance evidence presented above.

Interpretation Discipline

This page should be read within the framework of pulse-power engineering, nonlinear electrodynamics, and validation-stage deep-tech IP practice. It documents validation-stage measurement at TRL 5–6, not certified performance. The Three-Level Energy Model reference (Level 1 macroscopic boundary, Level 2 per-event partition, Level 3 gap-internal carrier dynamics) must not be collapsed into a single layer. The black-box boundary protocol distinguishes the ignition port (startup-only interface, disconnected after regime initiation) from the customer AC interface (operational output where load delivery is referenced).

How It Works · Architecture Reference
Final Interpretation Note

All operational parameters represent validation-stage measurement at TRL 5–6. A discrete startup impulse (~9 V × ~15 s ≈ 0.015 Wh) at the ignition port initiates the electrodynamic regime; per patent claim 1, the ignition port is then disconnected. Regime persistence under sustained load is observed consistent with the architecture-defined regulated feedback path (secondary winding (7) → rectifiers (17, 18, 19) → BMS / buffer control layer → storage capacitors C2.1–C2.3) at regime level (Level 2). At the complete device boundary, the canonical accounting identity P_in,boundary = P_customer + P_losses + dE_stored/dt is referenced; the boundary-level energy-origin question is the subject of the dedicated Where Does the Energy Come From page, and complete closure under independent third-party metrology is the TRL 6 milestone. Internal mechanism interpretation remains subordinate to boundary-level measurement.

Patents: ES2950176B2 (granted, Spain) · WO2024209235 (PCT). Regional examination: EP4693872A1 · US20260088633A1 · CN119096463A · IN 202547010911. Priority date: 05.04.2023. MICRO DIGITAL ELECTRONICS CORP S.R.L., Romania, EU.
Laboratory Equipment · Technical Reference

Laboratory Instrumentation Used in Validation Campaign.

Engineering transparency reference for the instruments used in the endurance validation campaign. Measurements at the canonical interfaces — customer AC interface (operational output) and ignition port (startup) — are referenced within the black-box boundary protocol.

Equipment Reference · 4 Categories

Instruments by Function

  • Load Control & Startup / Setup Sources
    • AKTAKOM ATH-8120Programmable electronic load
    • Hewlett-Packard 6632AProgrammable power supply used for startup / setup-related laboratory operations; not a continuous feed during the sustained endurance interval
  • Electrical Measurement
    • Hewlett-Packard 34401ADigital multimeter
    • HANTEK HDM3065BDigital multimeter
  • Frequency Monitoring
    • Rohde & Schwarz HM8123Frequency counter
    • Yokogawa TC110Frequency counter
  • Oscilloscope Measurement
    • LeCroy WaveSurfer 24Xs-ADigital oscilloscope
    • SIGLENT SDS1204X HDDigital oscilloscope

Instrument configurations were established for signal monitoring, measurement logging, startup/setup operations, and diagnostic analysis throughout the endurance validation campaign. The listed power-supply equipment must not be interpreted as a continuous external feed during the sustained endurance interval. Boundary-level measurements were performed within the black-box boundary protocol described on this page; complete closure of the canonical accounting identity at the complete device boundary is the TRL 6 third-party metrology milestone.